Getting Started with Uptime Kuma for Self‑Hosted Monitoring
A technical walkthrough of deploying, configuring, and operating Uptime Kuma with Docker Compose, status pages, and alerting.
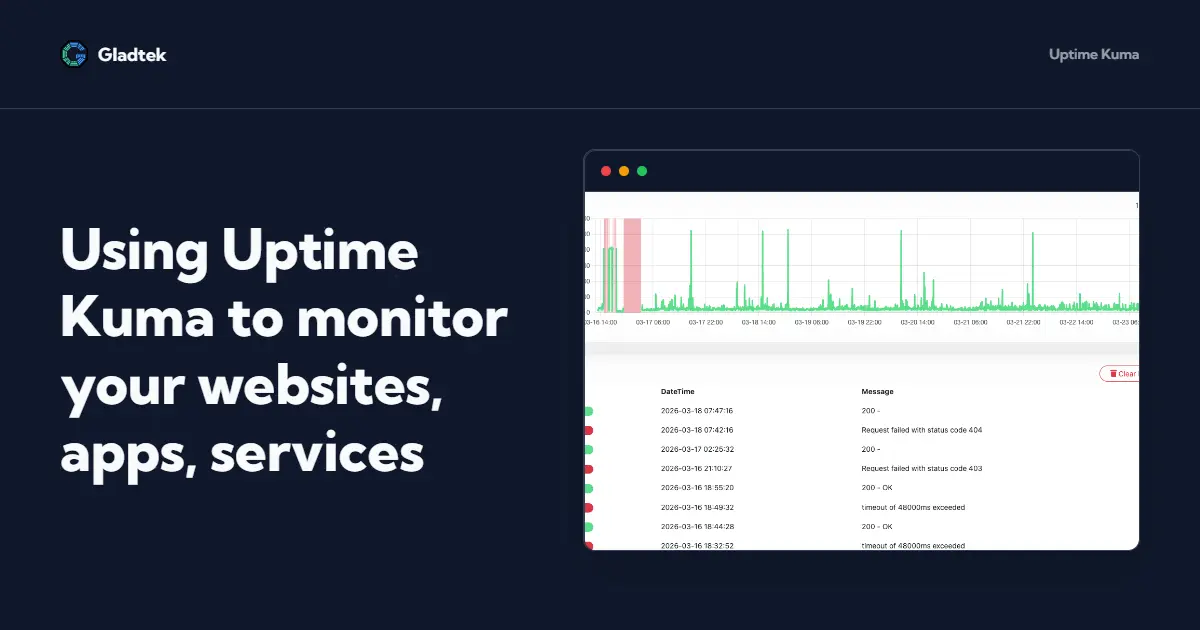
Uptime Kuma is a self‑hosted, open source uptime monitoring tool that you can run with Docker or directly on a server to watch your sites, APIs, ports, and more, with status pages and alerts.
What is Uptime Kuma
Uptime Kuma is an open source, self‑hosted monitoring platform similar in spirit to commercial uptime services, but designed to run on your own infrastructure. It provides a web UI where you define monitors, see historical graphs, publish public status pages, and configure notifications across multiple channels.
Key capabilities include:
- Monitoring of HTTP, TCP, Ping, DNS, SSL expiry, databases and more.
- Short check intervals down to 20 seconds, suitable for catching brief outages.
- Built‑in status pages and rich notification integrations like email, webhooks, Telegram and others.
Deploying Uptime Kuma with Docker Compose
The most convenient way to deploy Uptime Kuma in production or a homelab is via Docker Compose. This encapsulates the app, persists data, and lets you restart or upgrade it with a single command.
A minimal docker-compose.yml might look like this:
version: "3"services:  uptime-kuma:    image: louislam/uptime-kuma:latest    container_name: uptime-kuma    restart: unless-stopped    ports:      - "3001:3001"    volumes:      - uptime-kuma-data:/app/data      - /var/run/docker.sock:/var/run/docker.sock
volumes:  uptime-kuma-data:
Explanation of the important pieces:
image: louislam/uptime-kuma:latestpulls the official container image from Docker Hub.ports: "3001:3001"exposes the web UI on port 3001 of the host, reachable athttp://<host>:3001.uptime-kuma-data:/app/datapersists configuration, monitors, and history in a Docker volume so upgrades do not reset your setup./var/run/docker.sock:/var/run/docker.socklets Uptime Kuma introspect your other containers, which enables container‑aware monitoring.
To start the stack:
docker compose up -dAfter a few seconds, you can open the web interface:
http://<your-server-ip>:3001On first launch, you are prompted to create an admin account which secures access to the dashboard.
Creating Your First Monitors
Once Uptime Kuma is running, the next step is to define monitors for the services you care about. Each monitor runs checks at a configured interval and stores results that drive alerts and graphs.
HTTP and HTTPS monitors
HTTP monitors are the core building block for tracking websites and APIs.
Typical setup steps:
- Click Add New Monitor in the dashboard.
- Select HTTP(s) as the monitor type.
- Enter:
- A friendly Name like
Main Website. - The URL, for example
https://example.com. - An Interval, such as 60 seconds, which controls how frequently checks run.
- A friendly Name like
- Optionally configure:
- Status code expectations (for example, treat only 2xx as up).
- A keyword to search for in the response body to ensure the app is not only serving but also rendering expected content.
- Click Save to start monitoring.
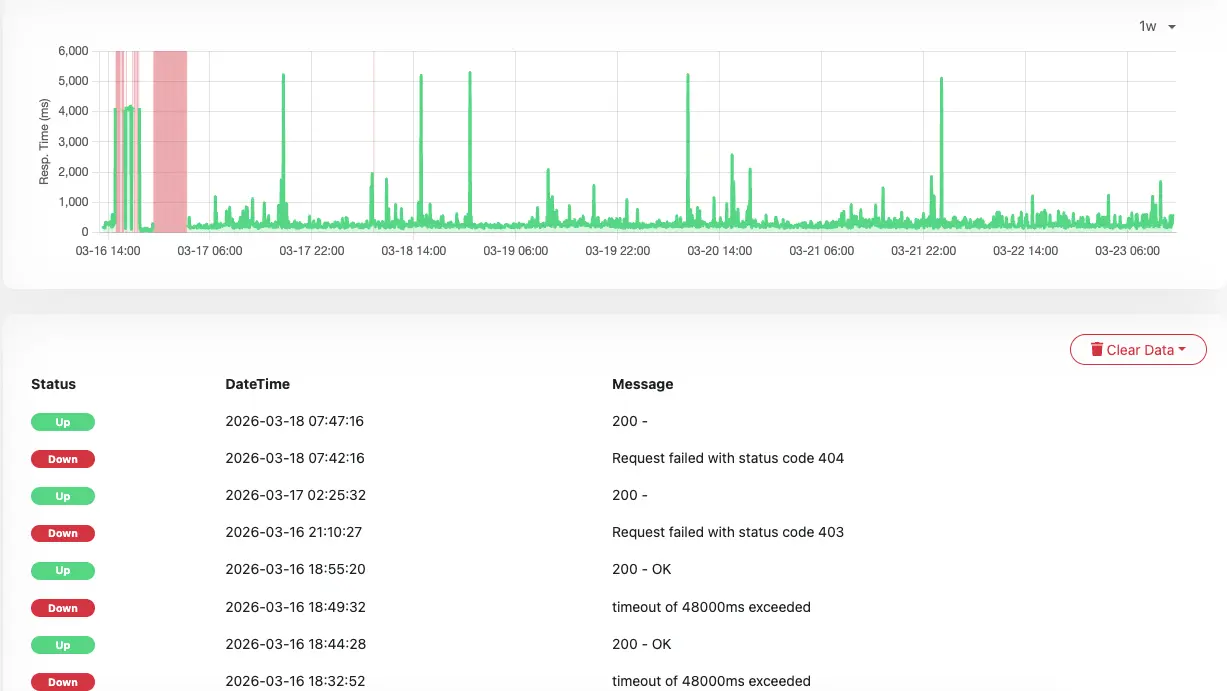
Uptime Kuma then continuously performs HTTP requests, tracks response times, and records failures that appear as red bars on the timeline.
Ping and TCP port monitors
For lower‑level infrastructure checks, you can configure Ping and TCP monitors.
Ping:
- Use when you want to validate network reachability of a host or device.
- Configure a hostname or IP and an interval; Kuma stores latency over time and flags packet loss as downtime.
TCP Port:
- Use when you want to ensure that a specific service port is open, such as a database on 5432 or an SMTP server on 25.
- Uptime Kuma attempts to open a TCP connection and treats failures as outages.
These monitors complement HTTP checks by detecting network and service‑layer issues that might appear before a web app itself fails.
Push monitors for internal jobs
Push monitors reverse the pattern: instead of Kuma polling your service, your service periodically sends a heartbeat URL.
This pattern is ideal for:
- Cron jobs or backup scripts that run on a schedule.
- Services behind NAT or CGNAT where inbound connections are not possible.
To configure:
- Add a new monitor and choose Push as the type.
- Note the generated URL and configure your script or app to perform an HTTP request to it every N seconds or minutes.
- Set the heartbeat interval to slightly more than the actual schedule; if Kuma does not receive a heartbeat within this window, it marks the monitor down.
Building Status Pages and Alerts
Uptime Kuma can expose friendly status pages and send alerts through many notification backends.
Public status pages
Status pages let you share the health of selected services without exposing the full admin interface. They are useful for end users, internal stakeholders, or as a simple SLO dashboard.
Core concepts:
- You can create one or more status pages, each with its own URL.
- Each page references a subset of monitors and can group them into sections like “Core APIs” or “Customer‑facing sites”.
- Uptime history is shown visually so visitors can see past incidents and overall reliability trends.
Combining a status page with a vanity domain via a reverse proxy such as Nginx or Traefik yields a polished, branded experience.
Notification channels
Notifications are the last piece that turns monitoring into a practical operations tool.
Uptime Kuma supports a range of channels including:
- Email, webhooks, and generic HTTP endpoints for integration with other systems.
- Chat and push services such as Telegram or ntfy for mobile and desktop alerts.
Typical workflow:
- In Settings → Notifications, create a new notification provider with any credentials or URLs required by the service.
- Attach that notification to one or more monitors, optionally tuning when alerts fire.
- Validate by simulating a failure or temporarily stopping a monitored service to ensure alerts are delivered as expected.
Hardening, Backup, and Operations Tips
Once Uptime Kuma becomes central to your observability story, you should treat it like any other production service.
Good operational practices include:
- Persistence and backup: The
/app/datadirectory contains configuration, monitors, and history; back up the underlying volume regularly so you can restore quickly after failures. - Authentication and 2FA: Protect the admin account with a strong password and enable two‑factor authentication in settings to reduce the risk of unauthorized changes.
- Reverse proxy and TLS: Put Uptime Kuma behind a reverse proxy with TLS termination so you can serve it over HTTPS and optionally restrict access by IP or VPN.
- Resource planning: The application has modest CPU and memory demands, which makes it suitable for small VPS instances or even boards like the Raspberry Pi, but more monitors and shorter intervals will increase load and storage footprint.
By combining containerized deployment, a thoughtful monitor model, clear status pages, and tuned alerting, Uptime Kuma can become a lightweight but powerful piece of your monitoring stack, whether for a homelab or production workloads.